

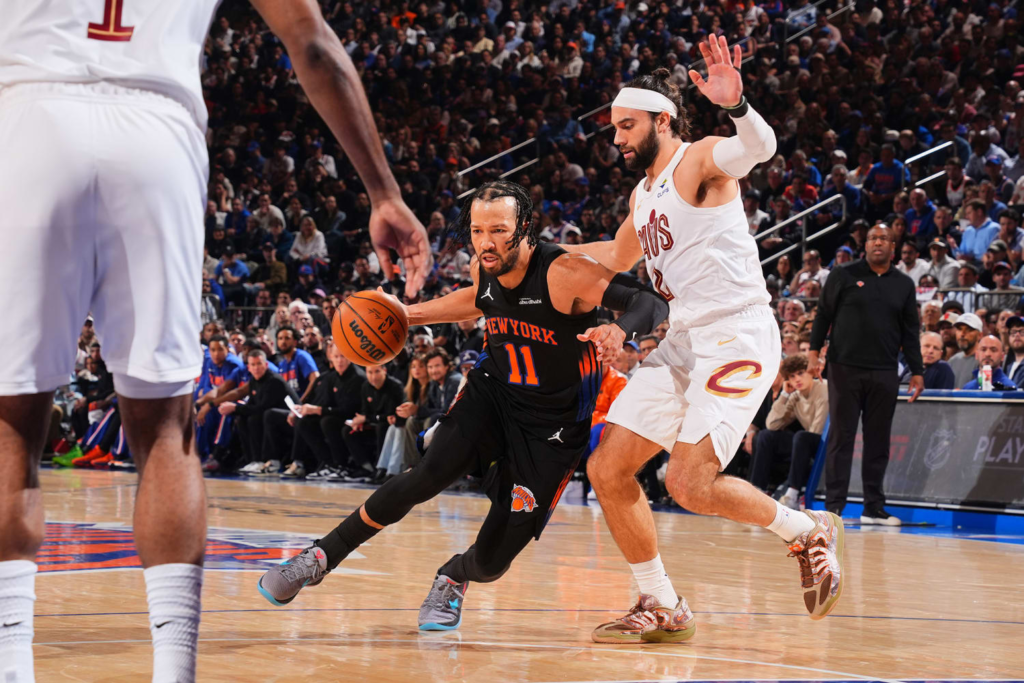
Eastern Conference Finals: Knicks vs Cavaliers
This years conference finals brough balance and defensive versatility. New York’s ability to switch defensively and limit easy opportunities in transition which forced Cleveland into difficult half-court possessions
The New York Knicks entered the Eastern Conference Finals with momentum and quickly turned it into full control of the series. What was expected to be a competitive matchup instead became a statement sweep, as New York eliminated Cleveland 4–0.
From the opening tip of Game 1, the Knicks imposed a physical, disciplined defensive identity. Their perimeter pressure disrupted Cleveland’s rhythm, forcing difficult isolation possessions and limiting clean catch-and-shoot opportunities. As the series progressed, Cleveland struggled to generate consistent secondary scoring, placing too much offensive responsibility on their primary creators.
Jalen Brunson was the steady force throughout the series, controlling tempo in late-game situations and consistently producing in half-court possessions. Karl-Anthony Towns provided interior scoring balance, stretching Cleveland’s defensive coverages and punishing mismatches around the rim and mid-post.
By Game 4, the series had fully tilted. New York delivered a decisive 130–93 victory, showcasing depth scoring and defensive rotations that completely overwhelmed Cleveland’s offense. The Knicks closed the series with confidence, entering the Finals on a major winning streak and establishing themselves as a disciplined, two-way contender.
Final result: Knicks sweep the series 4–0

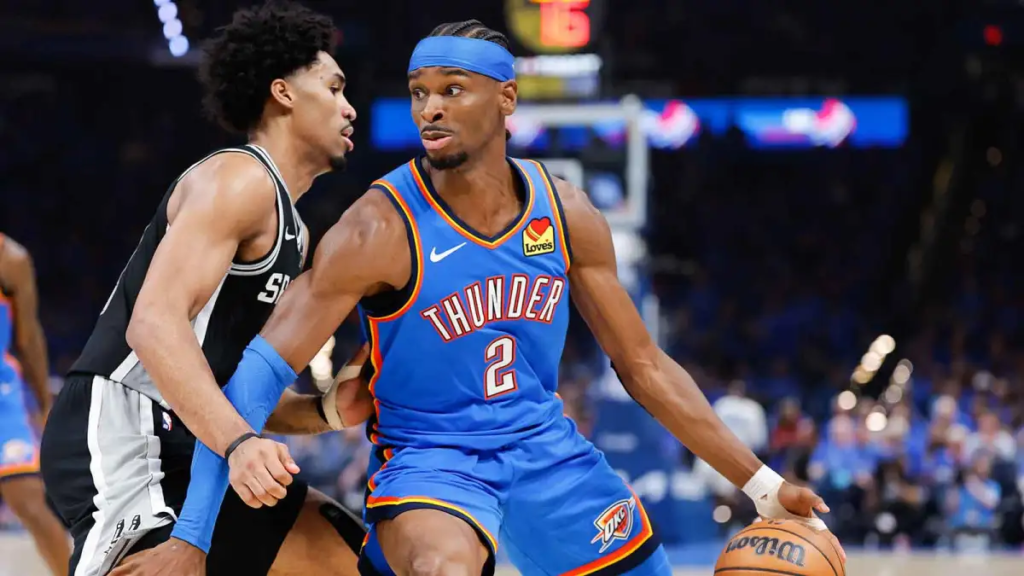
Western Conference Finals: Spurs vs Thunder
The Western Conference Finals delivered the opposite experience: a grueling seven-game battle between San Antonio and Oklahoma City that pushed both teams to their physical and mental limits.
Oklahoma City’s young core consistently challenged San Antonio’s structure with pace, transition scoring, and aggressive perimeter attacks. However, the Spurs’ size and interior defense anchored by Victor Wembanyama gradually shifted the series momentum.
Wembanyama’s impact extended beyond scoring. His rim protection altered driving lanes, forced contested finishes, and allowed San Antonio to play more aggressively on the perimeter. On offense, his spacing and finishing created matchup problems that Oklahoma City struggled to fully solve over seven games.
De’Aaron Fox emerged as the stabilizing guard presence for the Spurs, especially in late-game situations where tempo control became critical. His ability to push pace selectively while also slowing into structured half-court sets proved decisive in tight moments.
Game 7 encapsulated the series: a physical, low-margin contest where execution mattered more than volume. San Antonio ultimately closed it out 111–103, securing their place in the NBA Finals after surviving one of the most demanding series in the postseason.
Final result: Spurs win series 4–3

Key Player Stat-lines
New York Knicks def. Cleveland Cavaliers 4-0
Game Log
| Game | Score | Key Performers |
| G1 | NYK 115 – CLE 104 | Brunson 38 (15/29) | Mitchell 29 |
| G2 | NYK 109 – CLE 93 | Hart 26 (10/21, 5 3PT) | Mitchell 26 |
| G3 | NYK 121 – CLE 108 | Brunson 19, 14 AST | Mobley 14/6 |
| G4 | NYK 130 – CLE 93 | KAT 19 (8/11, 3/3 3PT) | Mitchell 31 |
New York Knicks: Series Averages
| Player | PPG | RPG | APG | FG% |
| Jalen Brunson | 25.3 | 3.3 | 7.0 | 46.2% |
| Karl-Anthony Towns | 16.3 | 13.5 | 2.3 | 66.2% |
| Mikal Bridges | 14.5 | 4.3 | 2.8 | 55.8% |
| OG Anunoby | 15.0 | 5.3 | 2.8 | 46.2% |
| Josh Hart | 12.8 | 6.5 | 5.5 | 46.5% |
| Landry Shamet | 8.3 | 1.3 | 0.7 | 88.9% |
Brunson averaged a near-triple-double across the sweep, peaking with 38 in Game 1. KAT posted double-doubles in 3 of 4 games and shot exceptionally, including an 8/11 outing with 3/3 from three in the clincher. Bridges was quietly efficient all series. Hart delivered rebounds, playmaking, and the glue plays throughout. Shamet erupted off the bench late with 4/4 and 5/6 shooting performances.
Cleveland Cavaliers: Series Averages
| Player | PPG | RPG | APG | FG% |
| Donovan Mitchell | 27.3 | 4.3 | 1.5 | 50.8% |
| Evan Mobley | 13.5 | 8.8 | 3.5 | 47.7% |
| Jarrett Allen | 9.3 | 7.5 | 1.3 | 52.9% |
| James Harden | 12.3 | 4.8 | 1.8 | 30.5% |
Mitchell was spectacular individually: 27+ per game on efficient shooting — but had no support. Harden shot just 30.5% for the series and piled up turnovers. Mobley was solid but limited as a creator. Cleveland was outscored by a combined 73 points across the four games.

Western Conference Finals
San Antonio Spurs def. Oklahoma City Thunder 4-3
Game Log
| Game | Score | Key Performers |
| G1 (OT) | SAS 122 – OKC 115 | Wemby 41/24 REB | Harper 24/11 REB, 7 STL |
| G2 | OKC 122 – SAS 113 | SGA 30 (12/24) | Castle 25 (10/17) |
| G3 | OKC 123 – SAS 108 | McCain 24 | Wemby 26, Vassell 20 |
| G4 | SAS 103 – OKC 82 | Wemby 33 | SGA 19 (6/15) |
| G5 | OKC 127 – SAS 114 | SGA 32 | Champagnie 22, Castle 24 |
| G6 | SAS 118 – OKC 91 | Wemby 28 | SGA 15 (6/18, -28) |
| G7 | SAS 111 – OKC 103 | SGA 35 | Champagnie 20 (6/10 3PT), Wemby 22 |
San Antonio Spurs — Series Averages
| Player | PPG | RPG | APG | FG% |
| Victor Wembanyama | 26.4 | 10.9 | 3.1 | 48.0% |
| Stephon Castle | 17.9 | 5.0 | 7.6 | 50.1% |
| Devin Vassell | 13.4 | 5.3 | 2.3 | 44.0% |
| De’Aaron Fox | 12.3 | 6.0 | 6.0 | 42.7% |
| Dylan Harper | 12.0 | 6.0 | 3.1 | 47.2% |
| Julian Champagnie | 11.9 | 6.7 | 1.4 | 44.4% |
Wembanyama was the anchor, a monster 41-point, 24-rebound OT performance in Game 1 set the tone. His shot-making, rim protection, and defensive gravity were crucial all series. Castle had turnover issues but delivered in the clutch, peaking at 25 in Game 2 and 24 in the Game 7 win. Champagnie was the X-factor in the close-out game. 6/10 from three for 20 points. Fox and Harper provided steady secondary production throughout.

Oklahoma City Thunder: Series Averages
| Player | PPG | RPG | APG | FG% |
| Shai Gilgeous-Alexander | 26.1 | 3.0 | 8.6 | 43.0% |
| Jared McCain | 13.1 | 3.1 | 1.7 | 38.4% |
| Alex Caruso | 12.0 | 2.7 | 2.7 | 55.6% |
| Cason Wallace | 10.1 | 5.0 | 3.0 | 57.2% |
| Chet Holmgren | 9.4 | 8.1 | 1.4 | 54.4% |
| Isaiah Hartenstein | 8.0 | 7.9 | 2.9 | 56.4% |
SGA was the best player in the series head-to-head: 26 PPG with elite assist numbers, but his shooting cratered at the worst time: 33% in Game 6 and 35% in Game 7 when OKC needed him most. Caruso was phenomenal in spots, going 11/19 with 8 threes in Game 1. Holmgren and Hartenstein were solid but inconsistent. McCain was streaky; 24 off the bench in Game 3, then 1/10 in Game 4. The series came down to San Antonio winning the three-point battle when it mattered most.